Posts

Showing posts from November, 2009

Google Earth Tour Feature Helps CNN Tell Story of Ft. Hood Shooting

I watched the CNN coverage of the Ft. Hood shootings and, during one segment of the program, the on-air reporter "told" the story using Google Earth's "tour" feature. This is a commonly used feature for those that are familiar with the touring function but what struck me was how much it put into context the unfolding of the day's events and timeline of the shootings. In the past, this type of report might have been supported with rather crudely-drawn 2D maps. In this case, not only was the reporter able to trace the footsteps of the gunman spatially, but the supporting aerial imagery added real context for those who may not be familiar with the extent of the base, but especially for those who might have been stationed there at one time. As I have commented before, there is some caution with this type of reporting. When the mainstream media uses imagery in this manner, the viewer often gets the sense of being there "live" and in "real-time.&quo
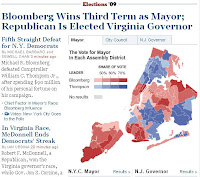
New York Times Maps the City's Mayoral Election

Image
The New York Times gets it! All the news that fit to map! In their coverage of the New York City mayoral and city council elections this evening, the New York Times displayed a precinct-level map of the voting on their home page. Now, you wouldn't show the results at any other geographic level, right? It's important for two reasons: one, every reader knows in which precint they voted and two, now you can begin to discern some trends in voting which can then be tied to demographic information and hence a better understanding of the political preferences of the voters.

Get Down to ZIP Codes for Political Analysis

I have a problem with CNN's John King and his "magic wall." In tonight's New Jersey gubernatorial election, it's impossible to draw any conclusions on voter preference (conservative vs. liberal) based on county-level mapping, which seems to be the only level of mapping that Mr. King has at his disposal. County maps show yield no true spatial information and the comparisons with the national presidential election of 2008 are spatially irrelavent because the mapping is too "coarse." These are relatively large counties and voting blocks are more easily discerned at the ZIP code level where most demographic patterns are established. Look at any of the psychographic profiling schemes established by the leading demographic data suppliers and you will find that you only begin to understand spatial phenomenon at the ZIP level and preferably, the Census Track. The political punditry will draw improbable conclusions if they stick with the County-level maps to unde

USAToday Looks at Bleak Jobs Growth Outlook for 2010

The job outlook for 2010 doesn't look very rosy according to a map published by USAToday . Though the prospect for job growth will rebound in some areas, most states will continue to so slow or no growth. Hardest hit continue to be Florida, the upper Midwest, and Nevada. The bright spots include the corridor of Texas, Colorado, Wyoming, Idaho and Washington State where jobs in energy and technology are likely to be found. By metro area, look toward Huntville, Alabama, my current hometown, where jobs gowth is expected to be the highest in the country with a projected growth of 2.9%. This high tech mecca will see job growth due to Base Realignment and Closure (BRAC) and the supporting jobs that will move into the region.