Posts

Showing posts from December, 2008

Weather Channel Utilizes "Near" Real-Time Images for Road Conditions
Image
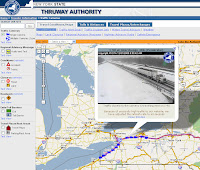
The Weather Channel has taken to augment their early morning traffic and travel reports with webcams of major roadways. It's another sign that people are not just tuning in to hear about their local weather but want as close to real-time information as necessary. Now, it's a too much for the Weather Channel to cover all major metros which is why people still tune into local news stations for helicopter reports and live feeds. But the information that will be required by travelers will be in-vehicle reports with live camera feeds to traffic conditions miles ahead of where the driver is currently. I think more drivers with in-vehicle navigation systems will demand connected devices to show these types of live feeds as many state and city departments of transportation currently do. As an example, the image above is from the New York State DOT. We are certainly getting closer to connecting people with the real-time information that they need.

Boston Globe-Year in Maps: How the Media Discovered Digital Geography

The Boston Globe published a review article on the "cartography boom" that seemed to capture the attention of readers and journalists in 2008. From the presidential elections to the terrorist attacks in Mumbai, the media used maps to better convey the story. As Adena Schutzberg pointed out in All Points Blog , the author deserves credit for recognizing the plethora of maps used by the media and that this was a noteworthy story to cover. I think the author, Drake Bennett, both captured and missed key points. What he got right was that the maps helped to distill the enormous volume of data that pores into news rooms and for that, maps provide an essential tool. What he missed was the sense of urgency and immediacy that readers seek when a breaking news story hits, and that maps and satellite imagery put the reader on the ground. Readers feel much more connected to the story if they understand location and context. Readers may not have been familiar with Mumbai or that it had

To the New York Post - Use the Map...Don't Hide it!

Thanks to a reader, I was informed that the New York Post is using MetaCarta's NewsMap. Great, I thought...another convert to using interactive mapping for local news reporting. But the Post has buried the NewsMap on the NYPD Blotter page . So, they make a fairly big deal of covering local New York news from the five boroughs but don't index every section with the NewsMaps technology. To be fair, the page on which the map is placed indicates that the NewsMap is in "beta" but the Post will never get feedback on whether readers appreciate the technology. There's not much "news" on the map and links from the "news tips" (clicking on one of the triangles indicating a news item) may bring you to a page that has a larger map window but not much additional news. So, my advice to the Post is to make this a little more robust even before you launch this in beta because it is just not that informative and rarely indexes news of interest. I'd advise

Geopolitics and Geography

On Time Magazine's "Person of the Year" cover, there is a map. Yes, it's hard to see unless you're looking for it. Otherwise you'll focus on the image of Barack Obama. The map in the upper left hand corner underscores the importance of the Middle East and that fact that it is one additional crisis of the many that Obama faces as he takes office. Time could have used an image of a militant, terrorist or pirate but a map is the only way to depict the problems that impact a concentrated region of the world that continues in turmoil. And yet somehow I think it speaks to our lack of geographic awareness, our lack of geographic knowledge both of juxtaposition and history. U.S. students continually under perform in a fundamental understanding of geography, culture and politics. It's time that those of us who live in and supposedly understand a world of digital geography where global communication is instantaneous that we take time to better understand cultural g

NY Times Goes Beta with "Represent"

Thanks to my colleague at Directions/ All Points Blo g (where you can find some of the technical details about the map), Adena Schutzberg, and a tip she received from Amy Grahran, there is news out about a new mapping feature offered by the New York Times called " Represent ." By typing in your address you can get information about your congressional or state elected officials, a map denoting the boundaries of their districts, and some news clippings about the most recent activities of these politicians. First, let me say that this is exactly the type of geographical information that should be provided by your local news source. It's short, concise, well-layed out and informative. Spot on! As this is in beta, there are obviously more features or changes to come. Let me offer a few suggestions: Aggregate more hyperlocal news such as from Topix or YourStreet. Sure, the NY Time is not the ultimate source but this type of aggregation is becoming more commonplace and it is a t

Useless Map Fades to Gray

I want to be fair to the Wall Street Journal but sometimes I'm just left scratching my head. In an article in today's WSJ, a thematic map of the median household income in and around the Chicago area was used to show the high income areas affected by the routing of a freight rail line. Canadian National Railway purchased a suburban rail line that they wanted to use for freight to bypass the congested lines through downtown Chicago. In fairness, I think the map enhanced the story. The problem was that you just could not read it. Once again, a shaded gray thematic doesn't really work for a print newspaper. Though the WSJ limited the gray tones to only four, the tones were too faded. And it took me almost five minutes to actually see that the rail line was overlayed on the map itself. It was not noted in the legend and I can only assume that they thought it was obvious. It was not. Now, unless you are faily familiar with thematic maps and you can discern spatial patterns, th

New York Times Explores the Changing Demographics of The Big Apple

One of the lead stories today in the New York Times discusses the demographic diversity of New York City in recent times. A thematic map of the five New York boroughs divided by ZIP code provides some details on median rent and median income between 2000 and 2007. The newspaper reports that a three year study confirms what some have suggested anecdotally about the changes in income, ethnicity, and poverty. For example, there was a decline by 17% of those who did not speak English in the home in Sunset Park, Brooklyn indicating a gentrification of the area that is heavily Hispanic and Asian. While the proportion of foreign born citizens remains the same, the proportion who are now American citizens passed the 50% level. The American Community Survey was the source for some of the data.

Time Magazine Maps the State of American Health

What's striking about some of the maps provided by Time Magazine in their article focused on the state of American Health is that they parallel another U.S. trend: spending on education. Once again the deep South, Kentucky and West Virginia come up short in statistics such as life expectancy and areas such as the upper Midwest, Utah and Colorado seem to trend higher. There is no secret here. Better educated people tend to understand the value of good health and the spatial correlation becomes obvious when you look at a map. This is not only a travesty but a failure of the local government authorities to act. This geographic phenomena hasn't changed in years and the worst part of it is that these states obviously invested their money poorly because another map in the same report shows that Federal Government spending on health care programs is actually pretty healthy. It's high time these officials looked at a map to see what a poor job they've done.

Wall Street Journal Places Image Map of Mumbai Attacks on Front Page

Today's front page of the Wall Street Journal features an image map of Mumbai annotated with the locations of the terrorist attacks. This map has been reproduced in other publications so there is nothing new except some brief notes on the event at each location. The WSJ is a little late to the game with this map especially since the headline on the image reads "Deadly Route" when in fact there is no identification of the route the terrorists took to reach each attack. A reconstruction of the route the terrorists used would indeed have been a better use of the map if such information has already been discerned. However, the online version of the same image map provides a timeline of the attacks from which you could discern the route and this same map has the events parsed by day during the 60-hour seige.

Wired Maps the World of Food, Crops and Politics

If maps do anything, they condense the salient points of news into a single, visual medium. In Wired Magazine's November issue, the author of the article " Feeding the World " uses a world atlas to identify trouble spots that hinder the proliferation of food production. The map highlights the problems related to climate conditions such as droughts or storm-related damage, as well as political issue such as food subsidies or export restrictions.