Posts

Showing posts from 2010

Want to Catch the World Cup at your Local Bar? Better Know Which Flag they are Flying

Looking for camaraderie and perhaps quaffing a few brews during the FIFA World Cup matches? You better know which way the local patrons are leaning before sending out a "whoop" and "holler" during a game. Well now the New York Times can help you find just the right establishment with an interactive map that shows you the local allegiances. Jack Dempsey's on West 33rd is obviously a U.S. hang out but Barolo's on West Broadway is going for the Italians. The Time's map shows that  Plein Sud, also on West Broadway, has both French and U.S. leanings. Would you like American or French fries with that burger?
As Fall Elections Approach Publications Ramp Up Interactive Maps

The New York Times has published a map of the fall senate, house and gubernatorial races from around the U.S. The interesting thing this time around will be what each publication has learned since the 2008 elections in using technology to display information geospatially. Flash technology was certainly preferred last time. My guess is we'll see lots of Flash and Flex this time around. The biggest challenge? Making sure each publication draws the House Congressional district boundaries correctly. What a nightmare! Just looking at the irregular shapes of each district is perplexing. Makes you wonder about the political "fist fights" that must arise out of gerrymandering these boundaries. Good luck!

Job Losses in New York City Documented by Subway Ridership Map

The New York Times has created an interactive map showing the gains or losses in subway ridership over the past year. The maps shows a graduated symbol on each subway stop and provides a tool tip indicating the stop, the increase or decrease in ridership and the number of average daily riders. Most striking, as pointed out in the article, is how you can map the areas hit hardest by the economic recession. It should serve as an invaluable tool for the NYC transportation authority as well as urban planners. But, unfortunately, it displays the tragic effects of a job losses and the potential impact upon the individual local economy around each subway stop.

Chinese Investments in Raw Materials Mapped by Forbes.com

Image
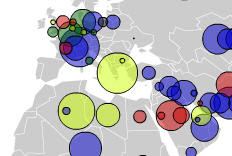
Forbes.com created a graduated symbol map (see thumbnail at right) of the investments that the Chinese have made in various raw material sectors such as energy, minerals, and transportation. The interactive map illustrates: the accelerated growth in the number of investments made over the past five years the size of each investment the industry sector Tool tips appear as you hover the cursor over each symbol that shows: the investor the amount of the investment when the investment was made the industry sector What is striking about the portrayal of the data is not the size so much as the rapidity with which the investments have been made over just the last two years. If you watch the animated sequence, you will see how many of the investments were accomplished just recently. The feeding frenzy for raw materials is what is driving infrastructure growth throughout the Mainland.

West Virginia Coal Mine Explosion: Mine Maps Offer Challenges to Average Reader

The New York Times published both a 2D map and 3D topographic perspective map of the coal mine disaster in Montcoal, West Virginia where 25 miners were killed. Maps should provide some context and while the Times does a good job of showing the basic location of the disaster, they ignored a few cartographic principals. First, the 2D map has an inset map to give the reader the general location of the disaster. Unfortunately, the boundary shown in the inset map does not match the boundary of the mine area on the 2D map itself so it's hard to correlate the two maps. Second, the 3D map shows the topography and a satellite image overlay depicting the surface of the mine as well as a map of the subsurface mine layout. However, the mine layout boundary should be projected onto the 3D topographic map so that the reader understands the surface extents. Over on USA Today , their map is solely to locate the mine with a "pin." They do not offer supporting maps of the subsurface a

Telegraph's Map Shows Political Battlegrounds in Upcoming UK General Election

Image
The Telegraph has developed a unique thematic map that displays the political landscape for the upcoming general election in the UK. Each constituency is displayed as a single hexagon and color-coded according to the predominant party results from the 2005 election. It is an unusual way of thematically mapping political tendencies since it totally removes any inherent political and geographic boundaries that might otherwise confine an interpretation of the spatial underpinnings. Selecting any single hexagon will review the voting results as well as some selective stats on crime, health and education.

USA Today/USGS Maps of Chilean Earthquake Aftershocks Use Thematics Improperly

The map of aftershocks from the Chilean earthquake last week reveals the incredible number of strong quakes that continue to jolt the region. Unfortunately, maps produced by the USGS and picked up by USA Today are inappropriately thematicized. The map shows the location of aftershocks marked by large circular symbols that are color-coded according to their most recent occurrence. Those that have been felt within the last hour are red; within the last day are orange; and those within the last week are yellow. It is a totally confusing way to map mainly because the idea should be to recognize both the location and severity. As they are portrayed, the symbols are all the same size and completely obscure most of the information. Here's my suggestion: Keep the color-coding but use a graduated symbol to represent the aftershock's magnitude. this would help cut down on what is now a very cluttered map. And it would have been a nice addition if it showed the major fault lines as wel

New York Times Map of Chilean Earthquake Area Highly Confusing

Where to start? The New York Times badly bungled the map showing the region devastated by the massive 8.8 magnitude earthquake that struck Chile late last week. The Times shows two maps , side-by-side, as an illustration of the region that felt the most impact of the temblor. The map on the left has region names declared disaster areas and their political boundary. The right hand map shows the region of severe shaking. The map on the right is NOT an inset map but that's the assumption I made. As I look at the map, the shake boundaries are delineated giving the reader the impression that this is an enlarged view of the left hand map. Looking closely, you can see that the shake area does not extend to the country's eastern border with Argentina. However, you would misinterpret the east boundary of the shake area as the border because of the delineation. In fact, a "shake" area should be graphically portrayed as a "heat map" with graduations of severity by col

Afghan Offensive Mapped by Wall Street Journal

The Wall Street Journal has developed an interactive map that shows the locations of military clashes, shootings, and other related violence on a daily basis. Tool tips provide the details of each incident and the viewer can navigate by a calendar. The recent offensive on the city of Marjah begins on February 13th and the reports from that area become more detailed.

Mapping Cuts in Early Childhood Education...Chicago Style

Budget cuts in Illinois funding for early childhood education played out geographically in an article published by Catalyst Chicago , an independent publication reporting on school reform. The article mapped the schools that had a waiting list for children wanting to enter the "Preschool for All" program. Budget deficits in Illinois meant that programs like Preschool for All could not be adequately funded. In the same article, a map was used to show schools that were denied funding statewide and displayed information such as the number of students affected and the amount of money requested for the program. It's maps such as these that help both citizens and politicians understand the impact, severity, and repercussions of government policy actions.

New York Times Embraces 3D for Mapping the Olympic Games

Yesterday, in All Points Blog , I surveyed some of the websites offering maps of the Olympic games in Vancouver and the the New York Times came out on top in my opinion in terms of total coverage. But more than the coverage, the Times has embraced 3D visualization technology that is not just fun to play with, but reflects both the hottest topic among geospatial professionals and the needs of the "prosumer." I say "prosumer" because navigating the 3D views of the alpine skiing venues are akin to working with 3D computer aided drafting models and takes a bit of proficiency with the mouse. Nonetheless, the use of digital terrain models and the integration with satellite imagery brings the viewer right into the venue almost as if they were there. My only criticism is that I wanted to get closer to the action. I had hoped to fully zoom into the ski trails themselves so that I could simulate a ski run myself. The use of Intermap's data was a good choice but again I

National Media Scrambles with Maps of Haiti

As the geospatial community rushes into support rescue efforts with as much detail as possible, the national media has produced a variety of different maps to help tell the story. Wall Street Journal - The WSJ has produced a series of three excellent, interactive maps : LATEST UPDATES: a thematic map of estimated damages by block and the locations of key places like the National Palace or the UN building as well as tent camps. BEFORE AND AFTER: a satellite image base with point locations of major structures where you can view photos of before and after shots. TECTONICS: A population map overlayed with a map of the Gonave microplate and the location of the earthquake with concentric zone showing quake intensity. USA Today - Map of earthquakes with more than 1000 deaths ; provides a bit of history of and the location of major crustal plates that gives the reader a lession in plate tectonics New York Times - Map showing magnitude of the disaster and details on the impact to d