Posts

Showing posts from 2009

Show me the Map on Climate Change: Time Magazine Misses Opportunity
Image
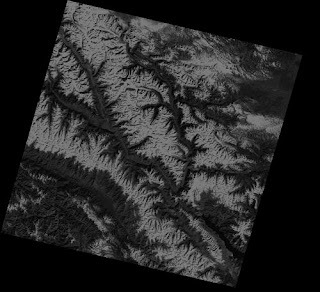
Page 60 of the December 14th issue of Time Magazine has a wonderfully useless map of Northern India that focuses on the small city of Leh. I visited Leh in 1979 and it is indeed on the top of the world. The focus of the Time article was climate change and the vanishing glaciers that feed the Indus and Ganges rivers and thus the population of millions of people. Where the map fails is in the type of map it should have displayed.  Time should have contacted the USGS where satellite images of the last 30 years showing comparisons of the region and would have allowed readers to SEE the changes. Just a map isn't cutting it anymore. The public is quite familiar with satellite imagery. Just ask any elementary school-aged student and they would be happy to show their parents how to use Google Earth. The USGS's EarthExplorer will allow the public to download imagery, many for free, such as the November 15, 1972 image of Leh and the Ladakhi Himalaya above. Time Magazine should hav

Media Ogles Over OnStar After Senator's Daughter's Car is Carjacked

OnStar is amazing technology, simple but amazing. The amazing thing is that it is a single button push for "all things location" at least as far a vehicle is concerned. Need directions? Push the OnStar button. Concerned about traffic? Push the OnStar button. Need help with a flat tire? Push the OnStar button. It's what all high-tech things should aspire to be! The incident involving Senator Bob Corker's (R-Tennessee) daughter is illustrative of both the advancements and advantages of location-based services (LBS). The Senator's daughter was assaulted and yanked out of her car when stopped at an intersection on the night of December 2, as reported by the Associated Press. The vehicle was equipped with OnStar. Police used OnStar's service to catch the carjackers and return the car later that night. In a similar incident in October, OnStar's Stolen Vehicle Slowdown feature was used to capture another carjacker in Visalia, California . In this case, OnStar wa

Google Earth Tour Feature Helps CNN Tell Story of Ft. Hood Shooting

I watched the CNN coverage of the Ft. Hood shootings and, during one segment of the program, the on-air reporter "told" the story using Google Earth's "tour" feature. This is a commonly used feature for those that are familiar with the touring function but what struck me was how much it put into context the unfolding of the day's events and timeline of the shootings. In the past, this type of report might have been supported with rather crudely-drawn 2D maps. In this case, not only was the reporter able to trace the footsteps of the gunman spatially, but the supporting aerial imagery added real context for those who may not be familiar with the extent of the base, but especially for those who might have been stationed there at one time. As I have commented before, there is some caution with this type of reporting. When the mainstream media uses imagery in this manner, the viewer often gets the sense of being there "live" and in "real-time.&quo

New York Times Maps the City's Mayoral Election

Image
The New York Times gets it! All the news that fit to map! In their coverage of the New York City mayoral and city council elections this evening, the New York Times displayed a precinct-level map of the voting on their home page. Now, you wouldn't show the results at any other geographic level, right? It's important for two reasons: one, every reader knows in which precint they voted and two, now you can begin to discern some trends in voting which can then be tied to demographic information and hence a better understanding of the political preferences of the voters.

Get Down to ZIP Codes for Political Analysis

I have a problem with CNN's John King and his "magic wall." In tonight's New Jersey gubernatorial election, it's impossible to draw any conclusions on voter preference (conservative vs. liberal) based on county-level mapping, which seems to be the only level of mapping that Mr. King has at his disposal. County maps show yield no true spatial information and the comparisons with the national presidential election of 2008 are spatially irrelavent because the mapping is too "coarse." These are relatively large counties and voting blocks are more easily discerned at the ZIP code level where most demographic patterns are established. Look at any of the psychographic profiling schemes established by the leading demographic data suppliers and you will find that you only begin to understand spatial phenomenon at the ZIP level and preferably, the Census Track. The political punditry will draw improbable conclusions if they stick with the County-level maps to unde

USAToday Looks at Bleak Jobs Growth Outlook for 2010

The job outlook for 2010 doesn't look very rosy according to a map published by USAToday . Though the prospect for job growth will rebound in some areas, most states will continue to so slow or no growth. Hardest hit continue to be Florida, the upper Midwest, and Nevada. The bright spots include the corridor of Texas, Colorado, Wyoming, Idaho and Washington State where jobs in energy and technology are likely to be found. By metro area, look toward Huntville, Alabama, my current hometown, where jobs gowth is expected to be the highest in the country with a projected growth of 2.9%. This high tech mecca will see job growth due to Base Realignment and Closure (BRAC) and the supporting jobs that will move into the region.

More Kudos for CNN on Somoan Tsunami Coverage

Chad Meyers of CNN provided a stellar, "on-air" explanation of subduction zones while describing the earthquake that generated the tsunami in Somoa and American Somoa. Maps and other reports from CNN at their website. Meyer's report included great visuals using Google Earth but his most impressive review of the situation included a description of what happens when the tsunami reaches shallow waters and the coastal shelf, pushing water inland. Kudos to Meyer for making complex geological and geomorphological phenomenon understandable to the average TV viewer.

Imagery of New Iranian Nuclear Site at Qum Raises Questions

Today, the New York Times and other media outlets released imagery from DigitalGlobe and GeoEye showing the location of the newly revealed nuclear material manufacturing plant in Iran. The GeoEye-1 half-meter imagery taken on 9/26/2009 shows the completed facility while an image taken in January by DigitalGlobe's WorldView-1 satellite shows the plant under construction. Certainly, U.S. intelligence agencies had their eye on this facility for some time. The imagery reveals excellent detail showing ventilation shafts, surface-to-air missile batteries and the supporting road network. However, what's missing? No scale bar, no north arrow. If the media is going to start regularly using imagery, maps, and other supporting map-based information, they better learn how to follow correct cartographic principals.

Afghan Violence Mapped

Leading up to the recent Afghan elections, violence plagued the country. The Wall Street Journal has documented the terrorist acts by mapping bombings, missile strikes, rockets and clashes on an interactive map . The map is supported by a calendar and time scale so the user can choose to see the chronologic order of the incidents. Though the map provides and interesting chronology of events, it lacks the ability to spatially reference or sort incidents by type which would help in understanding the proximity of events and their relative significance to each other, at least for the "arm chair" spatial analyst.

Employment Picture Animated in WSJ Map

The U.S. unemployment job statistics, on a state by state basis, are nicely explained in a map published today by the Wall Street Journal . What's particularly noticable, if you watch the animated sequence that shows how unemployment rates have increased across the country, is the story of how the states where manufacturing is most heavily concentrated has taken a beating while the agriculturally-based midwest has remained somewhat stable. The service economies of the east coast have been hit hard but not as bad as the tourism economies of Florida, Nevada, and California. Texas, stabilized by oil, has remained below the national average. The graphs also tell an interesting story as you see how some states have only just recently crept up to the national average.

Census Will Show Uptick in Hispanic Population

Image
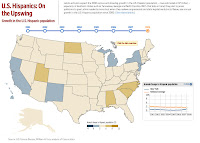
The Wall Street Journal published a map this weekend of the growth in the Hipanic population of the United States by state. The map was part of a related article on how the 2010 Census will demonstrate how large the population of hispanics has risen. The Flash map allows the user to review the statics by state for each year from 2001 and shows a related graph by percent growth by year. [There may be a bug in the map as swapping years caused a new browser window to open which showed nothing; going back to the original window then showed the selected year.] The decennial census is bound to be a boom for new maps depicting many geodemographic trends with basic population shifts being on the first allow law makers to begin haggling over how much money their district should receive. But there is a concerted effort by the Census Bureau to count every citizen and they are well on their way to doing just that.

Not Moonstruck by Maps of Lunar Landing Site

On this anniversary of Apollo 11, perhaps it's my expectations that the images of the lunar landing sites would have imagery good enough to see the actual lunar module but I did not find that the maps provided by Google and published online by CNN very exciting; informative, yes, but fairly mundane. The images had rather course resolution and when you zoomed into the landing sites, the image for Apollo 11, for example, changed to a map that was embedded over the actual site. I was looking to be moonstruck by the imagery my expectations might be clouded by the finer resolution we find from earth orbiting satellites. And the fact that the budgets for lunar exploration were drastically cut after the Apollo program have really not provided the means to do further lunar imaging. Some NASA budget have now only been modestly restored when President Bush said we were headed back to the moon. Check out some of the other Apollo landing sites (like 16 & 14) which have better resolution

"Le Tour" has "Le Cool" Maps

If you Google for a map of The Tour de France you'll find the same map issued by the tour itself...a basic route for the race. The mainstream media has essentially replicated that map without much enhancement. USAToday took the route and posted it to Google Maps but the interactivity is minimal. However, the Tour's own website is very cool. Each stage has the day's segment in a small map but the most nifty part is the " real-time " update of the riders portrayed against a topographic profile map. Lead riders and the peleton are shown in a "cartoon-like" portrait of the race along a road segment and the map is updated every minute or so. The map is updated with the leader's speed, the position along the post (in Km) and the remaining distance. Riders can be individually idenitified by their avatar in the cartoon. Nicely done.

Crains New York Keeping Tabs on City's Demographics

Clem Henricksen at ESRI helped point me toward some maps published in some of the recent editions of Crain's New York . The publication is using ESRI technology to create basic demographic information for the city. What's impressive is that they've devoted several pages to demographics and maps. Pictorially aethetic in a tabloid format, Crain's has done a nice job of displaying geospatial information. The information can also be found online .

WTO Maps Disputes Between Members

Image
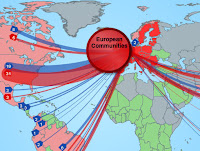
The World Trade Organizations (WTO) has created a map of that identifies the outstanding disputes between members. The map shows whether an individual country has been a respondent to or has issued a complaint against a specific country. The map at right shows the number of complaints (red) and responses to complaints (blue). By clicking on any individual country where a relationship has been discerned will display a list of the specific complaints. [The map reference is courtesty of Gary D. Price, Librarian and Editor, ResourceShelf and DocuTicker .]

Proximity Matters to Football Recruiting

Sports Illustrated writer Andy Staples validated a theory of his that when recruiting highly prized talent for college football programs "geographic distribution isn't a quirk." So, when he received a spreadsheet of 422 nominees for the annual U.S. Army All-American Bowl to be held next January in San Antonio, Staples went about "mapping" the location of each of their hometowns . Now, the map itself is not that well constructed. The Yahoo Map has the location of each hometown and the nominee's basic bio information such as high school and position. I was hoping to see more information such as proximity to nearest big time football program or schools that actively recruiting them. More interesting was Staples' assessement of how Pete Carroll of USC could field top talent within 119 miles of the school; or how Randy Shannon of Miami "should never waste a penny recruiting outside South Florida, has 30 nominees within 79 miles of his campus." Now

New York Times: Mapping Foreclosures in the New York Region

The New York Times has created a map of foreclosures in the New York region and found that they are highest where high minority populations exist. An interactive slider bar allows you to see the results from past years and you can zoom it to see the results by Census Tract. Dots on the map represent the location of foreclosures or multiple foreclosures. The basemap is by Google Maps and the data is from multiple sources. The region of coverage includes not just the boroughs of New York but also several counties in New Jersey as well as Suffolk County, N.Y. north of the city and the New Haven, CT area.

Time Magazine's 100 Most Influential People Map

The May 11th issue of Time Magazine is dedicated to the 100 most influential people in the world. You may have missed the map of "where they are from" as it is hidden in the double page fold-out section just after page 42. You won't find the map online unfortunately but it is quite a compilation of information because it maps all 553 of its Time 100 from this year as well as past years. I wouldn't say there are any patterns other than the geographic distribution is not a surprise. The state of New York has the most of any followed by California. The UK has more than any other European country; China has the most in Asia/Pacific. So, forget looking for a pattern...just enjoy browsing the fold out map and finding out more about those who touch our world in unique ways.

Startling Look at the Fading Auto Industry

Image
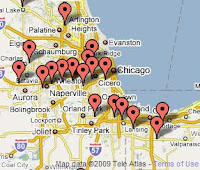
Several publications this week noted the closing of hundreds of car dealerships across the United States. Once the backbone of the American dream, the auto industry is drastically paring its dealerships. CNNMoney.com provided a map (at right) of the Chysler dealerships closing their doors, nearly 800 or one-quarter of the total number. Meanwhile, GM announced that 2600 dealerships were being eliminated. The closings will have a near immediate ripple effect across the country as many lose their jobs and communities will feal the impact of additional unemployment.

Washington Post's Space-Time Entertainment Map

Image
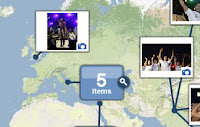
Need to know where your favorite entertainers are and when? The Washington Post has created an interactive map to show in both time and space (or is that time & spatial?) the location of photos, video, and news articles about celebrities. You can navigate the map by date and a slider bar at the bottom of the map can help you to narrow the time window when the images were taken. The technology uses Google Maps.

What's Your Adversity Index? MSNBC Maps Metros Feeling Recession Most

MSNBC has created an " Adversity Index " map of 381 metro areas in the U. S. In conjunction with Moody's.com , the maps displays a thematic map of whether a state is either in "recession," "at risk," "recovery," or "expansion." By clicking on each state a table will be displayed showing the largest metros and the economic indicators for each such as "employment," "single family housing starts," "housing prices," and "industrial production." Hover the mouse over each state and it will show you the aggregate indicators for each. The map also has a slider bar that will allow you to move along a time line from 1995 to present to thematically display the conditions at any particular time. This is an extremely good representation of the data that is highly useful to any company looking at moving into or expanding existing operations in any given region.

The News is the News in this Map of Publishing Defaults

There has been an unprecedented decline in the publishing business as a result of declining advertising sales due to the sluggish US economy. So hard hit has the publishing industry been that such stalwarts of the business like the Rocky Mountain News have closed shop while others cancelled their print editions entirely, slashed staff or moved to an online-only version. This map by the Wall Street Journal chronicles the bad news. This only tells part of the story as the remainder of the publishing business has not been without equal or worse devastation. Entire magazines have been discontinued and publishing companies like Taunton Press have gone so far as to eliminate the job of "publisher" and has reorganized staff into "content," "sales," or "marketing" with everyone reporting to a vice president.

USA Today Projects Employment in 2010

Thanks to Paul Overberg at USA Today , he clued me into a very comprehensive map the newspaper published showing the projected job growth through 2010. The job forecasts can be displayed by metro area or by state. You can click on the map of the metro areas and see, by quarter, the projected employment picture, both the number of jobs and percent change from previous quarter. Click on the list of metros and the metro is highlighted on the map. Jobs and employment can be segmented by industry sector and likewise illustrated geographically. As usual, USA Today always seems not only to have the best research but the graphic "eye" by which the location-based data can most easily be portrayed.

Keep up with the news folks! H1N1 is Spreading

The mainstream media is now behind in their coverage of the H1N1 (i.e. Swine Flu) coverage. Maps are not being updated with the latest outbreaks. None of the media outlets I cited in yesterday's blog post has kept up with the locations of the latest outbreak. HealthMap however is doing a good job.

Media Mapping in Full Swing to Track Swine Flu Pandemic

As the World Health Organization moves to alert level "Phase 5 " for the H1N1 Swine Flu, various media outlets published interactive maps of the outbreak. Here is a list of the mapping websites that the media outlets have created: Wall Street Journal New York Times CNN The Guardian (UK) USAToday A Google-based has been published based on news reports of the outbreak. (created by someone named niman [source All Points Blog] HealthMap is a mashup compiled from various (non-media) sources on all types of viruses

New York Times Maps the "Geography of the Recession"

Recently, I posted a link to maps by the Wall Street Journal about how they mapped the unemployment rate by state and they provided some useful metric from past years. However, the New York Times has taken it a step further by mapping the unemployment numbers by county . What the NYT has done exceptionally well is to "tab" through by metro, rural or manufacturing areas plus highlighting those counties where the "housing bubble" burst! A tool tip provides the county name, unemployment rate and one-year change. In looking for some spatial correlation among the data, the most surprising comes by looking at the one-year change map. I would not have expected to see such a high change in the south. The shift in manufacturing jobs southward and the accompanying increase in population density has certainly contributed to the higher unemployment picture of the "new south."

Wall Street Journal Plots Pirate Attacks

Some of the more recent pirate attacks off the coast of Somalia have been mapped by the Wall Street Journal . The interactive map provides a location and mouse-over tool tip about the details of the pirate's latest escapade.

Newly Available Study on GIS in Journalism

I received information about a newly released report from LSU and authored by Ben Wasike is entitled " The diffusion of GIS in journalism . " The abstract is as follows: "The purposes of this study were to determine the likelihood of reporters to adopt Geographical Information Systems and to predict the future of the diffusion of GIS in the journalism industry using the diffusion of innovations theory. The study used two data collection methods: in-depth interviews and a Web survey. The indepth-interviews revealed factors that will influence the diffusion of GIS, including the availability of map data, competition between media agencies, the ease of getting management to buy GIS once its functionality has been demonstrated to them, and the general use of secondary GIS products. The Web survey showed that 63% of the reporters were aware of GIS but only 11% of the reporters surveyed currently use GIS. OLS regression showed that men were more likely to adopt GIS than women,

CNN and the Overexposure of Google Earth

Last night while viewing a segment on CNN, they displayed the location of an event. In this case is was the lockdown at Radford University in Viriginia due to an off-campus fatal shooting whereby the suspect fled onto the campus grounds. During the report, in order to orient the viewer with a geographic perspective, CNN used Google Earth, as they do on so many occasions. First, of course I appreciate the supporting element of geography to report the story. What is unnecessary is to use a satellite image to identify the location of the incident. Showing the terrain and vegetation is overkill and confusing. A simple map is all that is called for. With today's tools, the map can even be more cartographically pleasing than ever before. However, the use of a satellite image is of no more use to the viewer than it would be if you show an icon of a gun to depict that the event involved a shooting. It's overkill. Moreover, I suspect that CNN seems to think that by showing a satellite i

Satellite Image of North Korean Rocket Worries Japanese

Image
The satellite image from DigitalGlobe's Quickbird satellite shows a three-stage rocket on the launch pad at North Korea'sv Musudan Ri. The image was released by DigitalGlobe and Reuters and published in many newspapers including Japan's Mainichi Daily News .

Malaysian Voting Results

The Star , a Malaysian newspaper, provides details on election results in the country by showing a map of poll results .

Wall Street Journal Map Shows Banks are Lending in Many Metros

Today's front page of the Wall Street Journal shows a map of how lending by banks has increased in many metro areas during Q4. Leading the way is my hometown of Huntsville, Alabama. The maps shows the increase in loan balances, an indication that some banks are lending and that the cash crunch has not strapped all municipalities.

Shrinking Wealth

Forbes published (March 30 issue) a map depicting the loss of wealth among the world's billionaires. The thematic map shows the total losses among all billionaires in each country. The online map is a little hard to read so Forbes provided an interactive "magnifying glass" to see the results of each country. As interesting is the number of countries without millionaires and to see which countries did not suffer to many losses. Bill Gates remains the richest man in the world even though his net worth dropped $18 Billion!

Super Bowl Twitter Chatter

It was bound to happen...a map of Twitter chatter . Several have been created so far. But the New York Times has put together a map of tweets during the Super Bowl between the Pittsburgh Steelers and the Arizona Cardinals. And it has an interactive timeline...push PLAY and watch the volume of tweets change as the game progresses. There is a legend that indicated certain categories of tweets such as the name of players or tweeted emoticons. Now, the jury is still out as to the value of Twitter, but as a social network, it's gaining lots of followers.

Living on Earth: Mapping Climate Change

WBUR in Boston hosted a segment for the "Living on Earth" show call Mapping Climate Change . The program interviewed Josef Kellndorfer, a researcher at Wood Hole Oceanographic Institute. It's nice to see the press giving a nod to remote sensing.

CIO Magazine: 15 Must See Images from Google Earth

Thanks to a tweet from Dave Sonnen, CIO Magazine published the " 15 Must See Sights from Google Earth ." Now, the images are pretty cool, but what would possess the magazine to focus on geospatial technology, or are they just looking for pretty pictures? Unfortunately, I think the later is true as the caption above the series of images encourages the reader to be an "armchair explorer" if not a world traveler. I think this is all too often the case when those in the mainstream media offer up eye-candy to readers and miss the true value of geospatial technology.

USA Today's Map Shows Housing Construction Shift Back to City

USA Today published a map (Google Map-based) highlighting the cities that have seen a growth in construction projects located in or near city centers indicating a shift away from traditional suburban development. Was it the high gas prices of last summer, the economic downturn or something else?

British Sub Bases: Off Limits?

Several media outlets published the Google Earth Imagery of the Royal Navy's submarine base. FOX News showed a variety of angles taken with satellite imagery. What's your opinion? Should supposedly secret military bases be off-limits to the peering eye of commercial satellites?

New York Times: Immigration Explorer

The New York Times has published an excellent interactive map of immigration patterns from the late 1800's until 2000 showing the migration of immigrants across the U.S. as well as the percentage of each group, region of origin, and where they settled. The county level detail map has tool tips showing the current total population from the U.S. Census as well as the population of foreign born residents. A slider bar allows the viewer to focus on a certain time period (in tens of years) and a drop down box allows the viewer to select a specific nationality of origin. Have fun playing with this one...it's one of the best interactive maps the NY Times has created.

ENVISAT Satellite Image Shows Wrath of Cyclone Downunder

Image
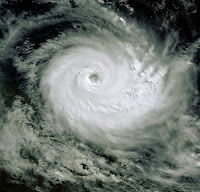
A European Space Agency ENVISAT satellite image of Tropical Cyclone Hamish graced the entire front page of Brisbane, Australia's The Courier Mail today showing the magnitude of the storm. The image was enhanced by Earth Snapshot and what a fantastic image it is. The detail of the cloud patterns is particularly crisp.

Sometimes You Just Need a Map to Get the Whole Picture

Earlier in the day, I read the details of a story in my local paper about how the pilot of a U.S. Navy FA-18 Hornet crashed into a home, killing four people, while trying to land his hobbled aircraft last December. Today's San Diego Tribune however re-created the tragic accident with a map showing the flight path of the jet fighter that had taken off from an aircraft carrier but developed engine trouble. The pilot had the option of landing at a facility away from residential areas but wanted to fly the craft to Miramar Air Station...but didn't make it. I was wondering what the flight path was and trying to imagine what happened. The Tribune's map provided the necessary graphical detail...as only a map can.

Mapping L.A.'s 87 Neighborhoods

The Los Angeles Times has launched an interactive map called " Mapping L.A. " and features informaiton on its 87 neighborhoods. According to the times, the website was developed with Django, OpenLayers, and PostgreSQL and the data is based on the 2000 U.S. Census. But according to the Times, the map will be somewhat dynamic: "Because L.A. is always changing, Mapping L.A. will change with it. As communities gain in size or importance, or diminish, we’ll reflect those changes in these maps. But, in contrast to the past, the boundaries we recognize today will not be lost. Every time we move a city block from one community to another, we’ll keep a record of the original map that can be republished any time it’s needed. We’ll also keep a log of changes on the site for use by anyone seeking to trace the city’s evolution. " There is not much additional information there but the boundaries themselves, but it's a start. Perhaps they will add hyper-local news feeds?

Tracking a Lone Wolf

The Rocky Mountain News' entire front page today is a map depicting the wanderings of a lone female wolf in search of a mate. The wolf has traveled over 1000 miles and the front page map shows her five-state trek. [On a sad note, the Rocky Mountain News' last issue is tomorrow as it is closing its doors.]

Mapping Meteorites

Meteorite hunters take note! Apparently, the area near Waco, Texas is a hot bed of activity. The Waco Tribune-Herald has a map on its front page to show you where to search!

Geocommons Launches Obamameter

FortiusOne , as part of their Geocommons initiative, today launched their "Dashboard of the Economy" or as they more aptley named it...their Obamameter , which is a map that reports on the U.S. economic situation and in particular where funding is being spent or requested. According to the company they are mapping "breaking news" and their Obamameter is one of a few "visual dashboards" to watch the current economic situation and the global economy.

Making The Housing Crisis 'Real'

I was watching ABC New's Nightline program last night as they reported on President Obama's plan to curtail the housing mortgage crisis. The report focused in on Phoenix and in particular West Zion Road in Maricopa, and by using Google Earth, zoomed into that neighborhood which exhibits the kind of blight that many cities are facing...multiple foreclosures on the same block not to mention the many other houses just simply up for sale. What struck me was that the use of web mapping and satellite technology somehow makes it not just "real" (the obvious reason for using satellite images that can zoom to street level), but familiar. Maps have always been used in some form of news reporting but not with the same specificity; not with the same ability to isolate on a particular street; not with the notion of proximity and scale. It's not only real, but personal. What's the most asked question when using Google Earth for the first time? Can I see my house? Well, t

Mapping the News One Newspaper at a Time

Image
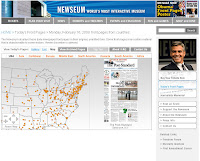
Thanks to good friend Hal Reid, I was pointed to a new web mapping application that the Newseum has developed that plots the the location of the nation's newspapers and displays the daily front page headlines. And it doesn't stop with U.S. publications. You'll find newspapers from around the world. I don't know how they capture all of this information but it is a fantastic resources for finding news from around the world in a geospatial context.

ABC Offers Maps of Australian Bush Fires

The Australian Broadcasting Corporation (ABC) is using a Microsoft's Virtual Earth-based map to report information about the extent of the bushfires wreaking havoc throughout the country. Up to date information on the location of fires and news about remediation efforts are being cataloged as well as the location of deaths.

Mission Loci Maps Hyperlocal Activity

Mission Loci , a project of the Cal-Berkeley to provide news and information about the Mission District in San Francisco, launched a mapping app specifically to monitor the impressions about American Apparel , a new fashion store that has moved into the SF Bay area. The app places the impressions of store owners along Valencia street on the map and also provides the location of a potential American Apparel store location. The mapping app is one of a growing number of sites introducing hyperlocal news and its potential impact on neighborhood culture and business.

Seattle Times: No Earthquake Map?

As we reported last July, The Seattle Times now has a " Mapping the News " page up on the website for local news stories. It is a Google Maps powered application that sorts by day and location. Looks like they used the Google Maps API and their dateline to post the news items. It's odd though that for today particularly with a minor earthquake striking the region that that isn't referenced. Only the epicenter is noted on the page with their story but I found it strange that more news about the quake isn't posted to the Mapping the News page. They have links to other references about the temblor but I expected more at their online portal. But the Times is better at it than the Post-Intelligencer which has no maps at all!

Unemployment Picture Not a Pretty Sight for any State

The Wall Street Journal published an interactive map by U.S. state showing the year-over-year unemployment trend for December. They've tied the map to a line graph of unemployment figures from each of the preceding months of December back to 2004. Other months can be selected as well and the map will change accordingly. Other, full year-over-year figures can be displayed as well, also back to 2004. They've done a good job with this implementation. However, the version published in the print edition is extremely hard to interpret as it shows unemployment by state as a thematic map in shades of gray. I can distinguish four shades; but not the five shades of gray used in the map.

Geographic Search Engine for News

A South African company, Muti , has indexed news by geography based on Yahoo Search called News Map . It uses Google Maps as a reference so that the user points to the map and a sidebar displays the search results. The news is not located by any designated "pin map" but if the user zooms in to more localized areas the search is sufficiently indexed to display news by a finer resolution of geography. According to the company: * Clicking on a country/region retrieves news about that country. * Switch quickly (edited) to another continent by clicking on the continent links in the header. * Zooming in one level will retrieve news at the state/provincial level. * Currently state level news is available for US, Canada, UK(Home Nations) and Australia. * Zooming in a second time will retrieve city news for large cities. * Over 3000 large cities are in the database. * Zooming out again will retrieve news at the respective level. This should not be confused

CNN Tracks its Journalists

During the U.S. presidential campaign, CNN was using their "magic map" for more than just election results. The were also using Skyhook Wireless technology to track their reporters as they followed the candidates. Skyhooks hybrid positioning technology (Wi-Fi, GPS or cellular) is embedded with iPhones and the reporters were displayed on King's "magic map". Watch the video demonstration by John King.

CNN Runs Satellite Image of Inauguration Parade Route

Just in case you didn't know exactly where President Barack Obama is, CNN ran a satellite image as a small strip at the bottom of the screen during the inauguration parade showing the location of the motorcade as a small blue dot and a "radar-like" circle "pinging" the location. I think that's going a bit overboard but, hey, satellite images are the hot thing right now. What can I say. CNN also has some initial images created using Photosynth from the inauguration ceremonies capturing " the moment ."

Media Tunes Up Mapping Apps for Inauguration

Several media outlets have published online map resources for the Inauguration of Barack Obama: The Wall Street Journal has posted a mashup of the location of inauguration events, balls, and attractions in addition to the inauguration parade route (thanks to the Google Maps & Earth blog for pointing this out.) The New York Times has a nicely done perspective view map that includes 3D building models set as a time sequence of events starting with the procession to the swearing in ceremony at the Capitol and completing the view along the parade route. USA Today has done a very thorough job with their map of including 3D building information, 360 IPIX imagery, and the locations of first aid, video screen locations throughout the Mall area, and security. The BBC has a static set of maps and aerial photos of Washington but it does have the location of the restricted streets and closed roads for the city center set up due to the parade. And, as reported in All Points Blog , CNN,

Time Magazine Map of Israel/Palestinian Region Leaves Many Questions

I like detail in maps but too often the media leaves it to the oft-times, geographically illiterate reader to figure it out. Time Magazine, in its January 19th issue (page 30), published a map of the Israeli/Palestinian conflict that provides information (or not) on the locations of Palestinian communities, the occupied territories procured during the 1967 Six-Day war and Gazan refugee camps. The map is quite detailed and based on information from the U.N. Office for the Coordination of Humanitarian Affairs . [Don't bother looking on the U.N.'s website for these maps as it will just confuse you.] But there are problems in interpreting the map. 1. While the Time Magazine map shows a nicely detailed thematic of the Palestinian communities, there are two shades of tan delineating these areas but the legend shows only one shade. Why two shades? For more of an explanation, I had to do a lot of digging. The lighter shades are considered under full Palestinian Authority control. The d

Cincinnati Enquirer Maps News, Crime, Traffic...and Everything Else

Image
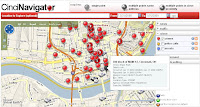
Thanks to Paul Overberg of USA Today , who sent a comment to our Directions Magazine article on " Crime Wave Mapping ," for pointing me to the Cincinnati Enquirer's CinciNavigator , a web mapping application that locates news, crime reports, traffic...you name it...in a single portal. CincNavigator uses a Microsoft Virtual Earth platform that is customized nicely to allow the user to isolate activities by date so as not to clutter the map. However, the tool tips as you mouse over each pin location have a way of obscuring some of the other information. The tip advises the user to zoom into the area and that's necessary to truly see incidents at a larger scale. But, overall, they have done an outstanding job with this portal.

Journalism Prize Awarded to Journalist Where Interactive Mapping Used

I am going to repost here an email from my good friend in Denmark who sent me information about the Calving journalism award that was given to a project where an interactive map was a significant part of the story: Cavling Prize for journalism with interactive map Berlingske Tidende receive on Friday Cavling prize for "crimes". This makes the most prestigious prize in the Danish media world this year given to a project where an interactive map has played a pivotal role. The card has been used to visualize cases from across the country in which the police did not respond to citizen inquiries. In some cases it has acted on human lives. Some examples are found for journalism research, but most cases come from readers who have been invited to submit information. Along with classic investigative journalism with documented examples of police failure, the story has been questioned by the reforms made by the Danish police. Police top commander has been dismissed and politicians will

Time Magazine: Mapping Energy Efficiency State by State

Image
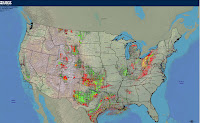
Which states encourage the most energy efficiency? Time Magazine has a basic prism map showing those states that do it best (see the Jan. 12 issue, page 34-35; the online article does not display the map unfortunately). What's interesting about this map is that you could pair it with those states with the most energy resources (see map at right from the U. S. Geological Survey's map of oil and gas exploration and production in the U.S.) and there is almost a 1 to 1 correlation with the exception of California, and there, their energy production is balanced with an enormous population. The south is particularly poor at encouraging energy efficiency mostly because energy is cheap (TVA and proximity to gasoline refineries). The midwest has lots of resources and places like Wyoming, the lowest ranked state, has an abundance of coal. Texas seems to have struck some balance but big oil can't last forever. Just ask T. Boone Pickens.

Wall Street Journal - Mapping Bank Failures

Image
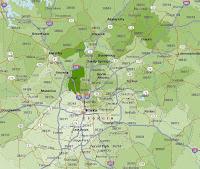
Maps don't usually appear on the front page of the "Money and Investing" section of the Wall Street Journal which is why this map of the latest bank failures caught my eye this Friday morning. The map shows the locations of those banks that failed in the Atlanta metro area and in particular in the suburb of Alpharetta. The map was a little hard to decipher unless you are aware of this particular grouping of suburbs which happen to be some of the wealthiest areas of central Georgia. I've attached here a map of the Average Household income (2004 Census data from Microsoft MapPoint 2006). The WSJ map is by ZIP code although this was not noted in the map caption (a failure I hate to see in a respected publication). So, the basic implication here, regardless of the underlying premise of the article which was the simple number of failures is that these banks are failing in some of the highest income areas of the state if not the country.